Life Science in 2D: Prof. Neil Hunt's Search for Momentum in Drug Discovery

Prof. Neil Hunt gained his PhD from the University of Cambridge in 2000 and became an EPSRC Advanced Research Fellow at the University of Strathclyde in 2006. He was awarded a European Research Council Starting Investigator grant in 2008 for 2D-IR spectroscopy development. After being appointed Professor in Ultrafast Chemical Physics at Strathclyde in 2016, he moved to the University of York in 2018 to take up the position of Professor of Physical Chemistry.
This article explores Prof. Hunt’s advancements in DNA melting studies and the use of 2D-IR spectroscopy to monitor drug-protein interactions, paving the way for breakthroughs in personalized medicine and drug development.
Evolution and Applications of 2D Spectroscopy
Two-dimensional (2D) spectroscopy is one of the most complex ultrafast spectroscopy techniques. It shares the same idea behind two-dimensional nuclear magnetic resonance (2D-NMR) proposed by Jeener in 19711. However, it was not until 1998 that the first experiment using ultrafast lasers was conducted2.
While conventional infrared (IR) spectroscopy typically measures the absorption of a sample in a solution or solid, 2D-IR spectroscopy uses a combination of broadband pulses to study the interaction of the many excited vibrational states of the sample. The differences between the 1D and 2D-IR spectra are exemplified in Figure 1, reproduced from an article by Prof. Hunt3. While 2D spectra can be thought of as a simple 2D map or fingerprint of a molecule – in practice, the use of femtosecond lasers to measure the spectrum leads to a wealth of new insight compared to an absorption spectrum. In particular, their large bandwidth allows 2D spectra to encompass many different transitions. Moreover, the ability to adjust the time delay between the pump and the probe pulses enables researchers to study the temporal evolution of the sample.
The 2D approach can be applied to many types of systems, for example, to study electronic transitions in the photosynthetic system or in photovoltaic materials, also known as 2D electronic spectroscopy (2DES). 2DES addresses electronic transitions in the ultraviolet (UV) to visible wavelengths, while most IR-relevant transitions are vibrational and span the region between 2,5 and 7 microns. The 2D approach can also be extended to other wavelength domains and transitions, such as terahertz (THz) and Raman, and even mixed approaches (Raman-THz)4.
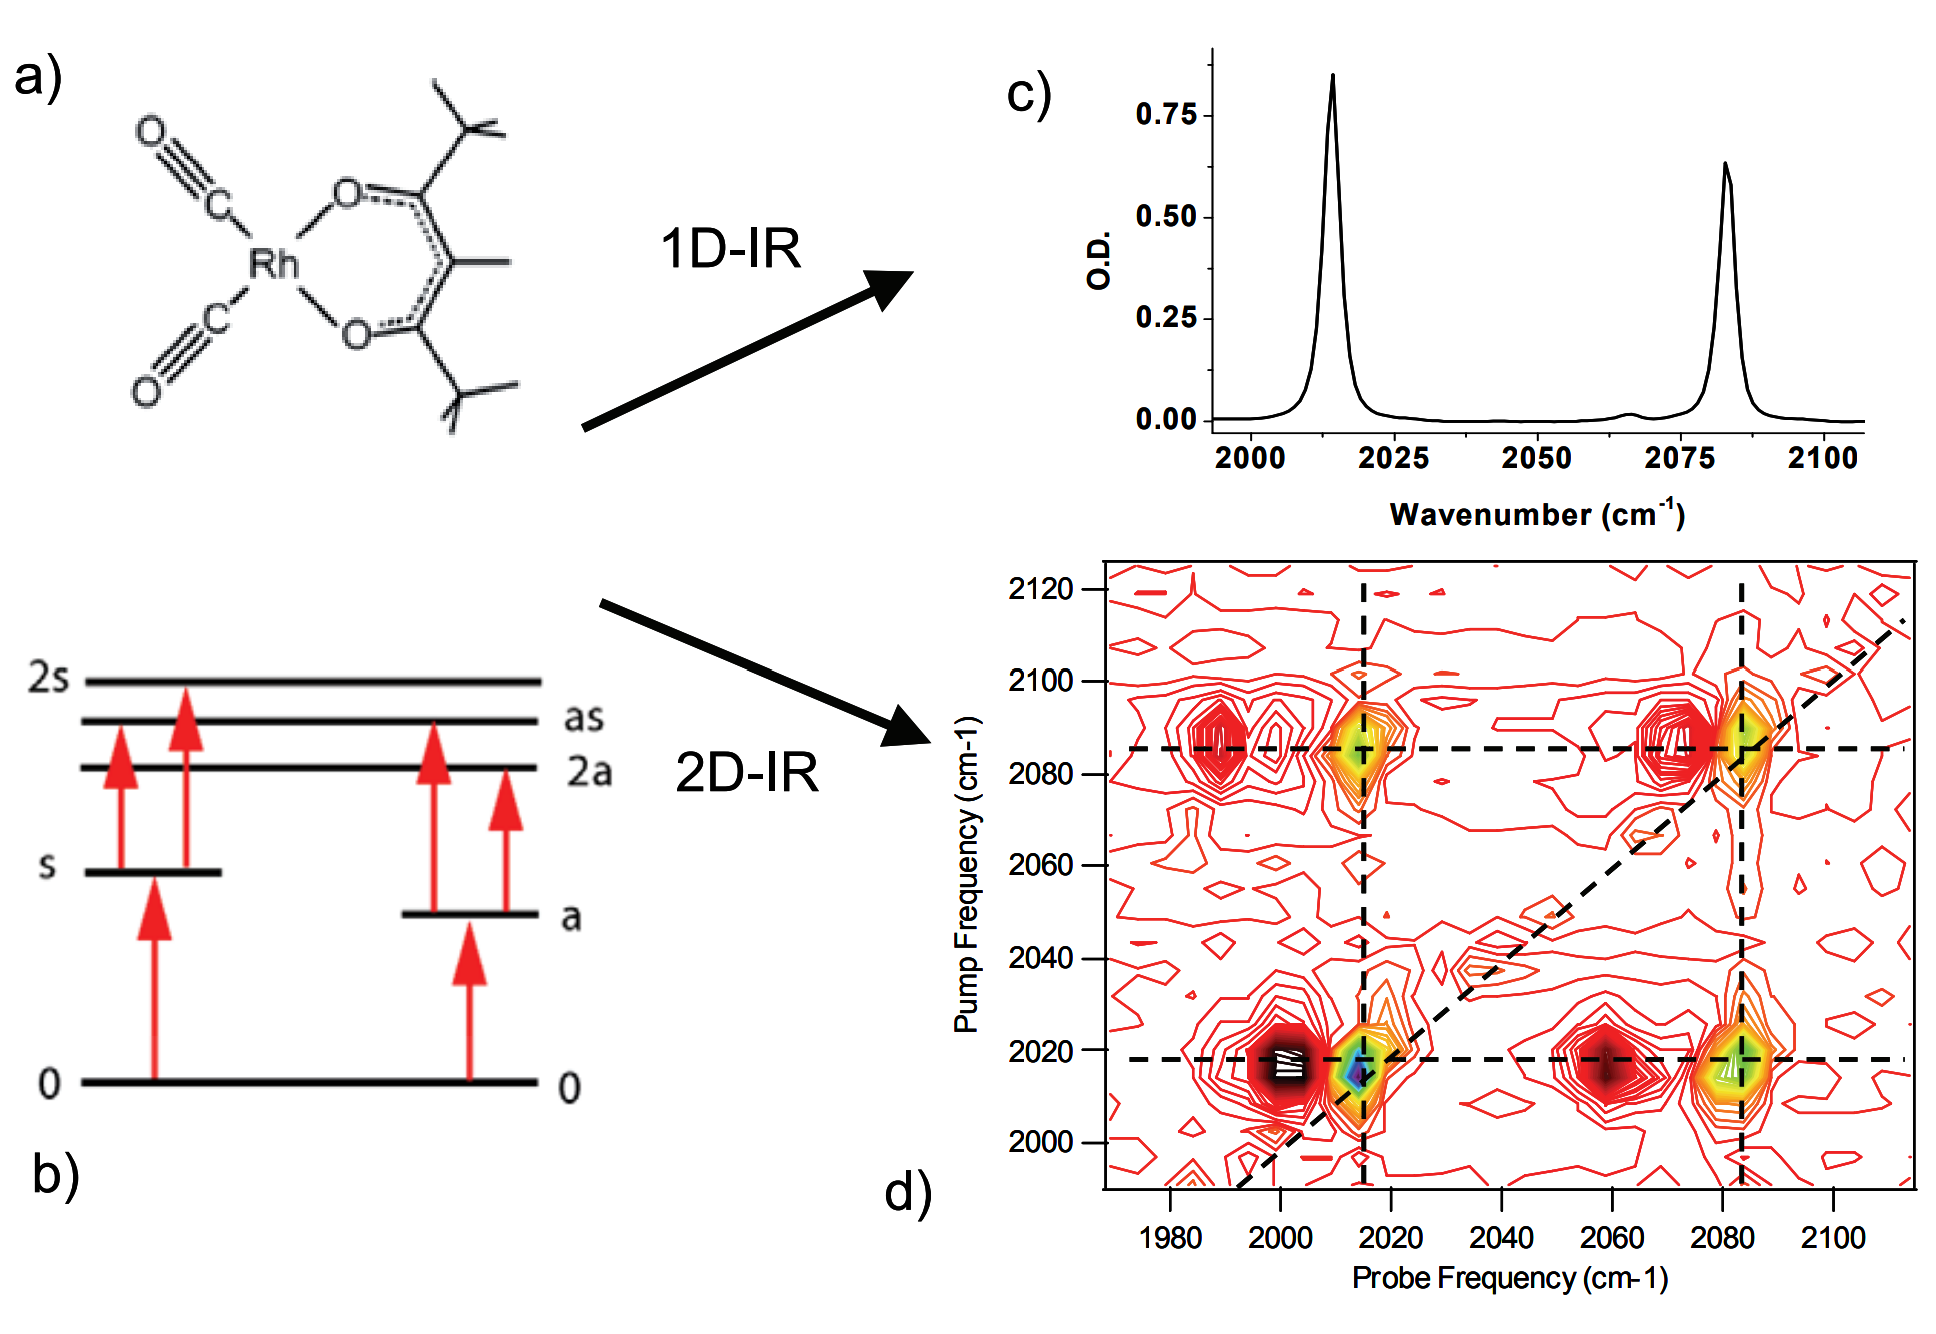
Figure 1. a) and c) Structure and FTIR spectrum of the Rhodium dicarbonyl (RDC) coordination compound showing two absorption peaks originating from the CO ligand stretching vibrational modes. b) and d) Energy level diagram and 2D-IR spectrum of the same sample showing the interaction (coupling) of the modes, here shown as color-contoured peaks. Peaks along the diagonal are equivalent to those observed in linear absorption experiments, as expected when the two wavelengths are equal3.
2D-IR is a widely used implementation of 2D spectroscopy, as Prof. Hunt explains, it is popular because of its applications in important life science studies such as protein folding, DNA and protein binding, and, more generally, solute-solvent dynamics. The high time resolution provided by femtosecond lasers also enables the recording of “molecular movies” of solute-solvent processes and chemical reactions, adding a previously unattainable temporal dimension and resolution.
The scaling in repetition rate of ultrafast laser amplifiers from 1–10 kHz in Titanium:sapphire systems to 100–500 kHz in ytterbium (Yb) solid-state platforms has greatly benefited all flavors of 2D spectroscopy by dramatically reducing acquisition times and improving the signal-to-noise ratio5. At the same time, the steady increase in pulse energy of these platforms provides energetic pulses in the mid-IR, where cascaded nonlinear conversion stages (via optical parametric amplifiers or OPAs) result in energy conversion with single-digit efficiency percentages.
A simplified illustration of a 2D-IR laser setup is shown in Figure 2. The main difference between a conventional pump-probe experiment and 2D-IR is the introduction of a dual pump pulse at an adjustable time delay, τ, which “prepares” the system for observation with the probe pulse arriving at the sample with a delay, Tw. The first two pulses are generally from the same OPA and reach the sample collinearly, while the (delayed) probe pulse can be from a different OPA to provide more flexibility, for example in two-color 2D-IR.
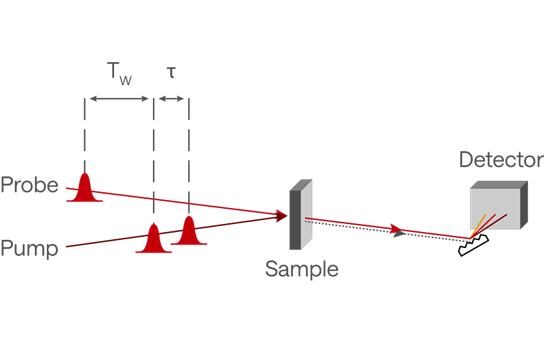
Figure 2. A simplified illustration of a 2D-IR setup. The pump beam is a mid-IR pulse from an OPA that is temporally split, often with a pulse shaper, to create an adjustable time delay, τ, which will be reflected in the frequency space of the 2D plot. A probe pulse, separated by a “waiting time”, Tw, reports the temporal evolution of the system after the pump pulses. When τ=0 the experiment provides a more conventional pump-probe spectrum with a delay Tw.
Prof. Hunt has been using 2D-IR spectroscopy for almost 20 years and his involvement with this method extends well beyond his laboratory. In fact, he has been collaborating for many years with Rutherford-Appleton Laboratory’s (RAL’s) Central Laser Facility to develop new tools for 2D-IR and other spectroscopy modalities. In addition, in June 2024 he hosted the 11th Coherent Multi-Dimensional Spectroscopy (CMDS) conference at the University of York. In this profile of Prof. Hunt’s activities, we asked him to illustrate two of his flagship projects: the so-called melting of DNA and the far-reaching project to monitor the binding of active pharmaceutical ingredients (API), components of every drug, to proteins carried in the bloodstream.
DNA Dynamics During Melting
In his study of the melting of DNA6, Prof. Hunt wanted to look at the structural dynamics of a portion of a nucleic acid molecule following a sudden temperature increase which causes the melting of the double-helix. The relevance of this work lies in understanding the molecular-level processes underlying the recognition of nucleic acids such as RNA and DNA that are key to biological processes such as transcription and replication.
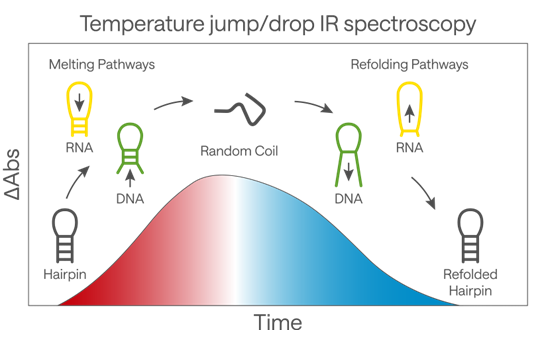
Figure 3. Temperature effects on nucleic acid spectroscopy.
In these experiments, a nanosecond laser pulse, tuned to the absorption of water, is used to rapidly heat the sample by approximately 10 °C. This takes the nucleic acid strand, in this case, a short hairpin (a short section of either DNA or RNA with the strand folded over in a loop to form base pairs with the same strand), above its melting temperature. The advantage of IR spectroscopy lies in its ability to differentiate processes at the level of chemical bonds, such that specific bands identify the melting of AT base pairs while others show changes in GC base pairs. By designing a hairpin featuring mainly GC base pairs but with one AT pair at key positions, Prof. Hunt’s team was able to investigate the detailed molecular mechanism of melting. The most exciting aspect of the experiment was its ability to rapidly cool the sample, allowing the unfolded hairpin to refold in real time. For the first time, nucleic acid refolding was successfully observed using femtosecond IR lasers.
Advancing Drug-Protein Binding Studies
Before delving into Prof. Hunt’s work on the binding of drugs to proteins in the bloodstream, it’s important to understand the status quo of protein IR spectroscopy. The so-called amide I absorption band of proteins arises from the C=O stretching mode of the peptide link. This band is rather broad and centered around 1650 cm‑1. It is also very important because of its sensitivity to changes in the protein conformation, such as those occurring when other molecules like ligands bind to sites in the protein structure. In other words, the amide I band “reports” on conformational changes in the protein, for example, when a drug binds to it.
As Prof. Hunt explains, the amide I band overlaps with the absorption band of water present in any biological environment (Figure 4, left side). This overlap prevents us from using IR absorption spectroscopy or FTIR spectroscopy to assess changes in the amide I band stemming from the binding of ligands. Substitution of regular water with D2O shifts the absorption band of the solvent to approximately 1200 cm-1 (Figure 4, right side), eliminating the overlap and enabling observation of shifts in the amide I band. Unfortunately, substituting water with D2O is expensive and prevents systems from accurately mimicking the in vivo environment. This limitation likely contributes to the low success rate of only 3–4% for potentially useful APIs, and such a low yield results in long lead times and high costs associated with any new drug development.
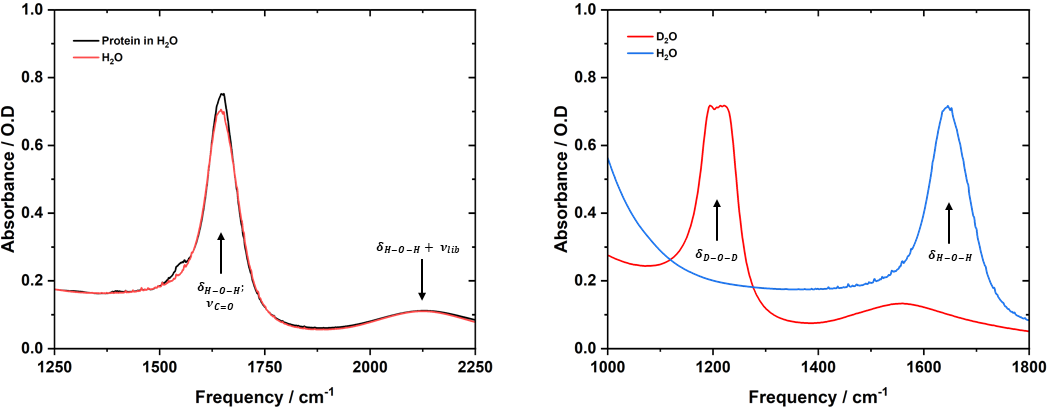
Figure 4. Left side: Absorption spectra of a protein solution in water. The water absorption band ẟH-O-H is depicted in black. Right side: The D2O absorption band, equivalent to ẟH-O-H, is located at approximately 1200 cm‑1, far away from the protein amide I absorption band at 1650 cm‑1.7
Work in Prof. Hunt’s laboratory has shown that 2D-IR spectroscopy provides a workaround because amide I band changes can be detected label-free in the presence of water. This means that the subtle shifts in protein binding and conformation become visible using 2D-IR. This capability allows 2D-IR to directly assess, in blood serum, both the percentage and type of proteins that bind to a drug. For example, the sensitivity of 2D-IR is illustrated in Figure 5, which displays the 2D-IR spectrum of serum samples containing γ-globulins and albumin. The 2D-IR spectrum shows two peaks corresponding to albumin and γ-globulins. The assignment of these two contributions is achieved by comparing this spectrum with those of the individual proteins (Figure 6).
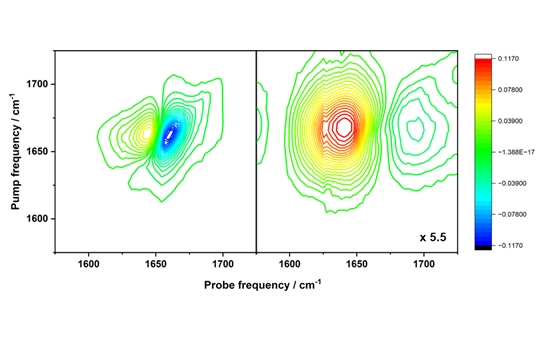
Figure 5. Left side: 2D-IR spectrum of serum samples containing γ-globulins and albumin. Right side: 2D-IR spectrum showing small thermal response of water which is time-separated from that of the serum proteins, and which can be sued to standardise spectra for analysis.
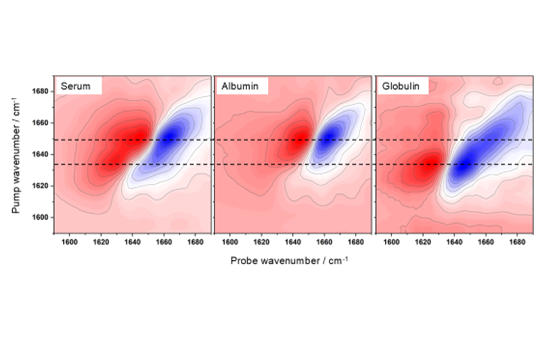
Figure 6. 2D-IR spectra of serum (left), serum albumin (middle), and γ-globulins (right). Dashed horizontal lines indicate the peak positions of albumin and γ-globulins.
This example indicates the exciting prospect of directly measuring the albumin-to-globulins ratio (AGR) in serum in a minimally invasive way. This ratio is a very important clinical indicator of the health of an individual because it reflects a range of metabolic indications and can be used to indicate liver diseases, malnutrition, and the prognosis for certain types of cancers.
More recent results in Prof. Hunt’s laboratory show an even more exciting prospective of using 2D-IR as a tool for personalized medicine 8. His team was able to identify differences in the 2D-IR spectra of human serum proteins when four commonly used drugs were bound to the proteins (Figure 7). These spectra were obtained using machine learning, though its description is beyond the scope of this article.
As Prof. Hunt explains “Changes in the shape of the band upon the addition of physiological levels of paracetamol (Figure 7) showed not only that drug binding could be detected and quantified, in contrast to IR absorption methods, but also that obtaining physical insight into the interaction was possible at micromolar drug concentrations, well below those detectable directly.”
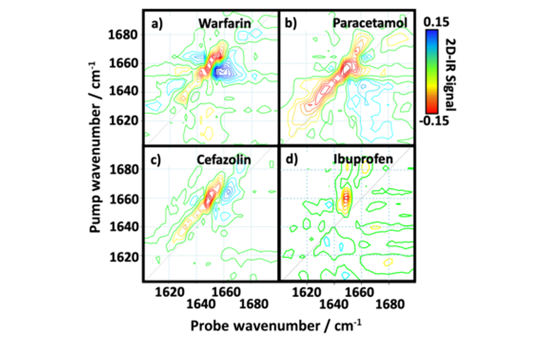
Figure 7. Results of a 2D-IR study using machine learning to identify drugs bound to blood serum proteins. The spectral changes attributed to each drug by machine learning algorithm following their addition to neat serum: (a) warfarin, (b) paracetamol, (c) cefazolin, and (d) ibuprofen.8
The exciting prospect of using 2DIR to assess drug concentrations in human blood in a minimally invasive way, within minutes, and with a resolution not achievable with other instruments, may open a new path towards personalized medicine. This possibility was recognized with the “Economic Impact Award” that Prof. Hunt received from CLF in 2023. In addition, Prof Hunt received also a Strategic Equipment Grant from EPSRC. This award will be used to build a specialized high throughput 2D-IR instrument in his laboratory at the University of York based on the LIFEtime setup at the CLF. The new instrument at the University of York will also be accessible to academic and industrial users from outside the University (Figure 8).
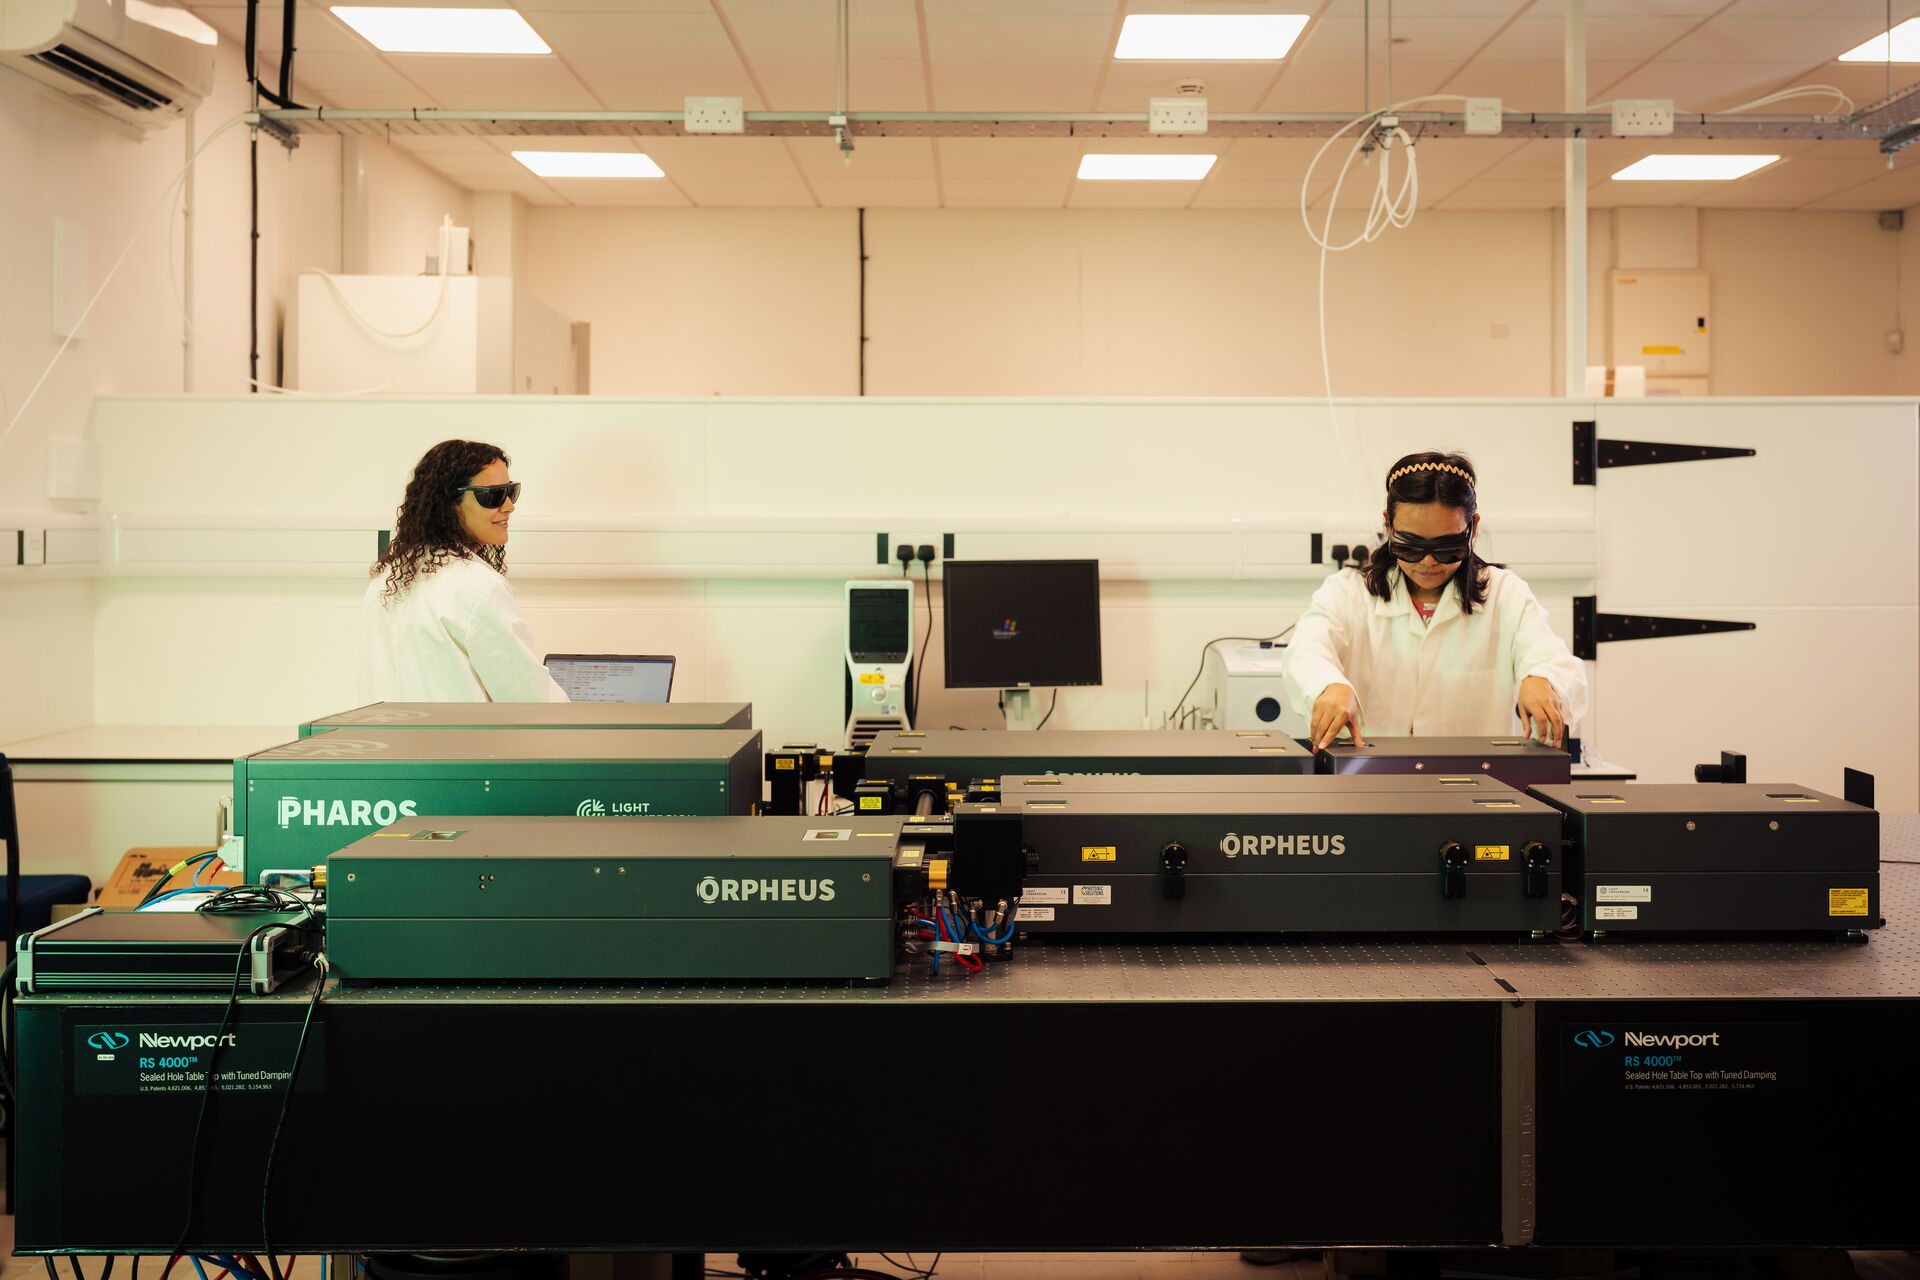
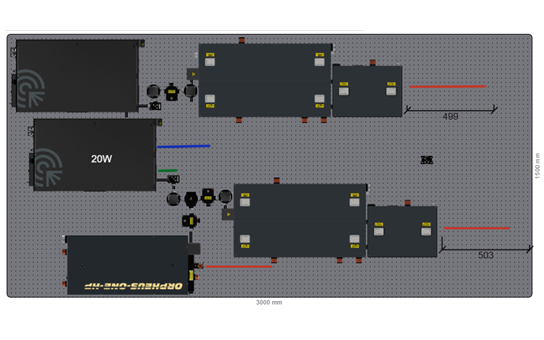
Figure 8. Laser spectrometer setup for the High-Throughput 2D-IR Analysis of Biomolecules Under Physiological Conditions project at the University of York’s HT-2D-IR Facility, featuring Light Conversion’s Yb-based PHAROS femtosecond lasers and ORPHEUS OPAs, supplied by Photonic Solutions Ltd.
The Advantage of Yb Lasers
As Prof. Hunt explained, there are still many problems to be addressed to increase the robustness of 2D-IR protein analysis, ranging from spectral interpretation to data analysis. A major step in the speed and reliability of data acquisition came from the transition from Titanium:sapphire lasers operating at 1–10 kHz to Yb lasers with 100 kHz repetition rates, such as those used in CLF’s LIFEtime setup. The improved quality of measurements provided by 100 kHz systems has been established in the cited work by Zanni.9
The availability of Light Conversion’s lasers and OPAs in Prof. Hunt’s laboratory will greatly increase the speed of development of this technique. On-demand access to state-of-the-art instrumentation will, for example, allow exploration of a range of different topics as well as investigation of how 2D-IR methods can be harnessed to new approaches, such as artificial intelligence, to enhance the interpretive ability of 2D-IR to solve next-generation problems in biomedical technology or drug design.
References
1. J. Jeener, Lecture presented at Ampere International Summer School II, Basko Polje, Yugoslavia, 1971.
2. P. Hamm, M. Lim, R. Hochstrasser, Structure of the amide I band of peptides measured by femtosecond nonlinear-infrared spectroscopy, J. of Phys. Chem B, 102 (31), 6123-6138 (1998).
3. N. Hunt, Ultrafast 2D-IR spectroscopy – method and applications, Spectr. Europe 20 (2), 7-10 (2008).
4. J Savolainen, A. Ahmed, P. Hamm, Two-dimensional Raman-terahertz spectroscopy of water, PNAS 110 (51), 20402-20407 (2013).
5. P. Donaldson et al., Breaking barriers in ultrafast spectroscopy and imaging using 100 kHz amplified Yb-laser systems, Acc. of Chem. Res. 56 (15), 2062-2071 (2023).
6 C.P. Howe et al., Sequence-dependent melting and refolding dynamics of RNA UNCG tetraloops using temperature jump/drop infrared spectroscopy, J. of Phys. Chem. 127 (7), 1586-1597 (2023).
7. S. Hume et al., Measuring proteins in H2O with 2D-IR spectroscopy, Chem. Sci. 10, 6448-6456 (2019).
8. N. Hunt, Using 2D-IR spectroscopy to measure the structure, dynamics, and intermolecular interactions of proteins in H2O, Acc. of Chem. Res., 57 (5), 685-692 (2024).
9. K. M. Farrell et al., Shot-to-shot 2D IR spectroscopy at 100 kHz using a Yb laser and custom-designed electronics, Opt. Express 22, 33584-33602 (2020).